The thing about infrastructure is that most people don’t think about it unless it’s not working properly. When a bridge is closed or a roadway is under construction, if a water main bursts or a train is delayed, that’s when infrastructure gets your attention.
When infrastructure is working well, so does the economy. If it's not, goods don't get delivered, business deals don’t get done, commuters lose hours in traffic.
Analysts note that investing in both new infrastructure and current maintenance stimulates the economy. They say infrastructure spending has a significant “multiplier effect,” meaning that the economic gains are greater than the amount spent. A 2014 University of Maryland study found that infrastructure investments added as much as $3 to GDP growth for every $1 spent, with an even bigger effect during a recession. That’s why investing in infrastructure is vital for economic growth.
Building a Nation
The founding fathers recognized the importance of infrastructure to the success of the new country. As early as 1784, George Washington proposed a national highway, uniting the western frontier with the cities of the east, opening “a wide door and making a smooth way for the produce of that Country to pass to our Markets.” So, determined to see it succeed, he set out from his Mount Vernon estate on horseback and surveyed 680 miles in five weeks, looking for the best route for the National Road, the nation’s first interstate highway. (In 1806 Congress authorized the construction of the National Road—now known in many places as Route 40—connecting Cumberland, MD, to the Ohio River.)
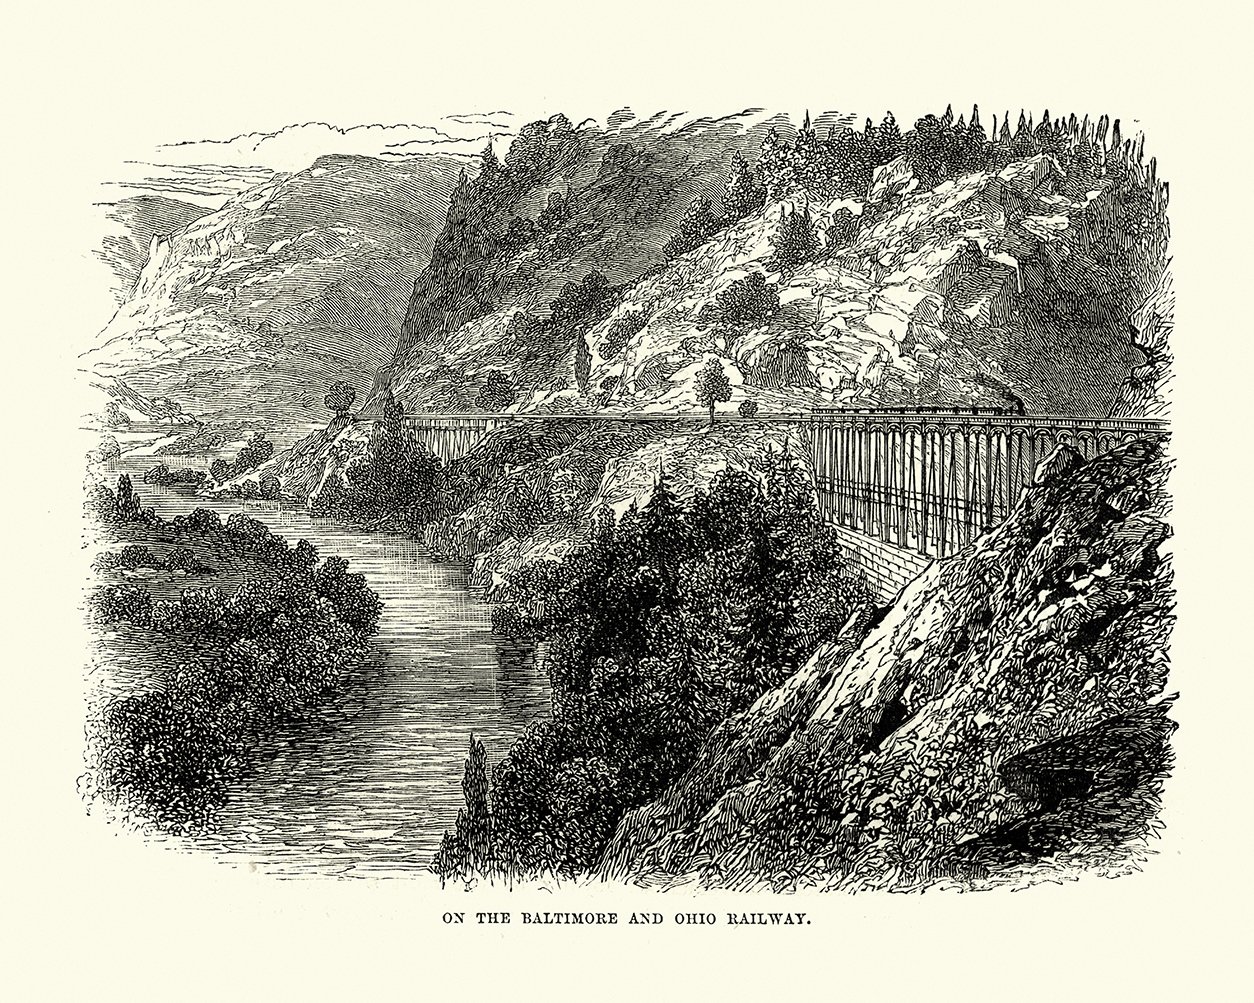
By 1825, the Erie Canal opened, connecting the Great Lakes with New York City via the Hudson River at Albany. Three years later, the steam-powered Baltimore & Ohio rail line ushered in the era of railroad building, which created thousands of miles of track and countless bridges and tunnels, linking cities and states in the ever-expanding nation.


Vintage engraving of a view of the Baltimore and Ohio railway, 19th century. Credit: duncan1890, iStock
During the Great Depression, Franklin Delano Roosevelt’s public works program put men to work by building thousands of miles of roads, bridges, and tunnels, not to mention creating a myriad of parks, playgrounds, and many other structures. Twenty years later, amid postwar prosperity, Dwight Eisenhower urged that "a modern, efficient highway system is essential to meet the needs of our growing population, our expanding economy, and our national security." The interstate highway system and its present-day 47,000-plus miles of asphalt is the result.
Although developing the nation’s infrastructure has been a monumental achievement, its upkeep might be an even more difficult task. Many structures and systems date back to Roosevelt’s time or before. Roads deteriorate. Bridges fail. Wastewater systems overflow. Nearly every aspect of our nation’s infrastructure could use a boost, from rickety bridges to outdated sewer systems to expanding access to broadband internet. Yet money for repair and upkeep always seems to be scarce.
Since the 1980s, the American Society of Civil Engineers (ASCE) has compiled regular "report cards" on the state of U.S. infrastructure. In its 2020 report, the ASCE found that the nation’s infrastructure averaged a “C-,” meaning that conditions were “mostly below standard,” exhibiting “significant deterioration,” with a “strong risk of failure.”
As a national infrastructure bill makes its way around the halls of Congress, here’s a summary of where different infrastructure systems stand as well as individual grades issued by the ASCE.
Mass Transit
America’s transit systems need some help. Currently, there’s a $176 billion transit backlog, a deficit that is expected to grow to more than $270 billion through 2029, according to the ASCE. Meanwhile, transit ridership is declining, a trend compounded by the COVID-19 pandemic, meaning less revenue for improvement projects. Delays due to infrastructure issues and constant repairs are the norm in aging subway systems in Boston, New York, and Washington, D.C. (Boston’s system is the nation’s oldest, dating back to 1897!) It’s not all bad news, however. Newer cities on the West Coast—Seattle, for example—have been investing billions in mass transit projects over the last several decades, lessening congestion and improving air quality. That trend looks to continue as the urban population expands.
Worldwide, by 2025 it’s estimated that municipalities will break ground on roughly $1.4 trillion in new light rail and metro projects. Still, aging systems need some attention now. ASCE grade: D-
Bridges
Several bipartisan bills have been introduced in Congress over the last decade to provide federally funded programs for bridge improvements, replacements, and/or repairs. And our nation’s bridges could use it. According to a 2020 report from the American Road and Transportation Builders Association, more than 47,000 bridges in the U.S. are in poor condition and in need of urgent repairs. The organization, which analyzes data from the Federal Highway Administration and releases an annual report on bridges, estimates it will take more than 80 years to fix all the nation's deficient bridges. The report notes that these deficient bridges are crossed some 178 million times a day. Some of the most notable bridges deemed deficient in the report include New York's Brooklyn Bridge, which opened in 1883; Memorial Bridge connecting Washington, D.C. to Arlington, Va., across the Potomac River; and the San Mateo-Hayward Bridge, which spans California's San Francisco Bay. ASCE grade: C+

Washington DC, USA skyline on the Potomac River with Lincoln Memorial, Washington Monument, and Arlington Memorial Bridge. Credit: SeanPavonePhoto, iStock
Power and Energy
The energy industry literally powers a huge segment of the economy—and affects many others. Maintaining a network of electric power transmission and distribution lines, oil and natural gas pipelines, and storage facilities is essential to delivering affordable and reliable energy to U.S. businesses and consumers. Unlike other forms of public infrastructure, American energy infrastructure is largely privately owned, operated, and financed.
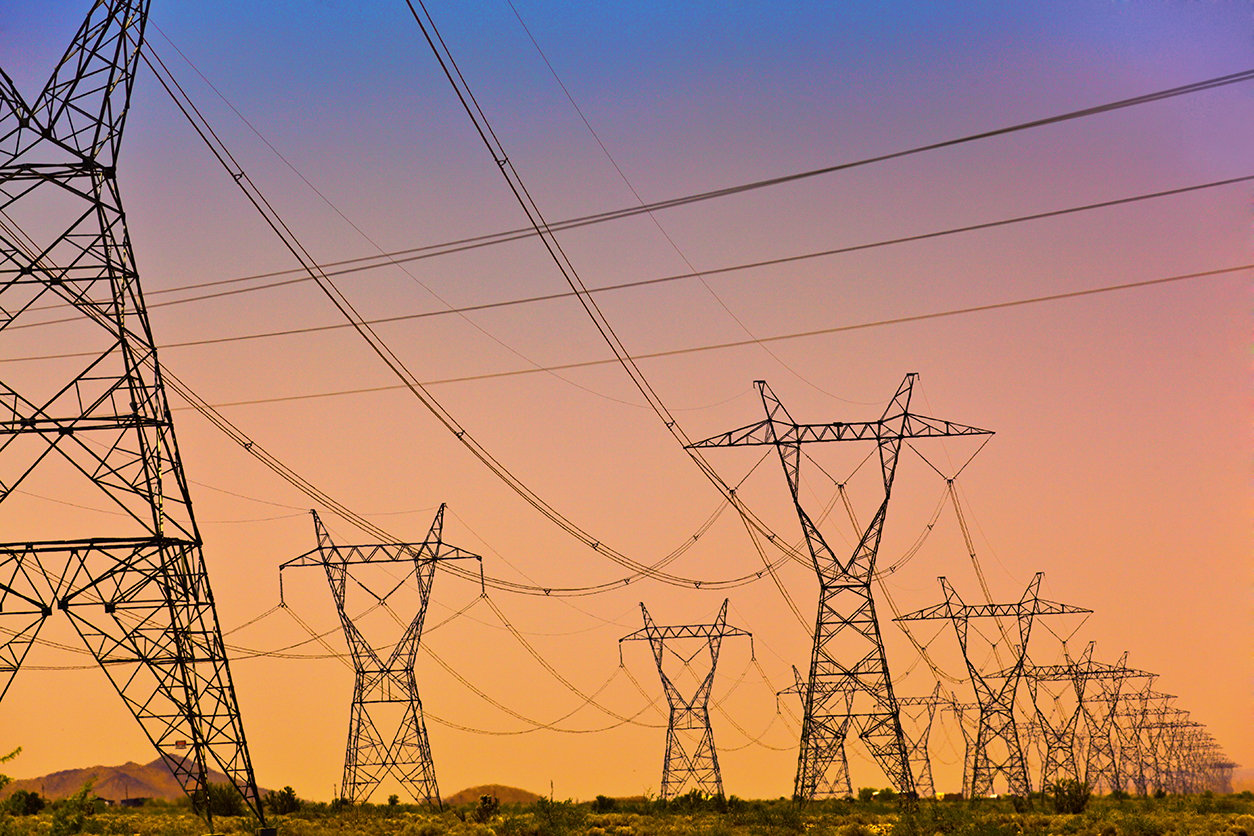
In our digital world, Americans increasingly rely on readily available and uninterrupted electricity. But the majority of the nation’s grid is aging, with some components over a century old—far past their 50-year life expectancy—and others, including 70 percent of transmission and distribution lines, are well into the second half of their lifespans. Distribution is a key failure point in the electric grid in terms of system reliability. The distribution system accounts for 92 percent of all-electric service interruptions, a result of aging infrastructure, severe weather events, and vandalism. These costly transmission and distribution problems result in power outages that are estimated to cost U.S. households $28 to $169 annually.

 Credit:YinYang, iStock
When it comes to oil and gas infrastructure, much like the electric grid, the nation’s pipelines are also aging. Leaks and line failures are increasingly commonplace. America’s more than 190,000 miles of oil pipelines and 2.4 million miles of gas pipelines supply 65 percent of the energy we use. But more than half of the natural gas transmission and distribution network was installed before 1960, with urban systems being among the oldest. The good news is that in recent years, new technologies have improved cost-efficiency, and extended service life. These new technologies have also greatly eliminated incidents in newer systems. ASCE grade: D+
Railroads
Railroad infrastructure tends to fare better than other categories on this list. The primary reason is that freight rail, which runs over approximately 140,000 rail miles, maintains a strong network primarily through direct shipper fees. These fees, charged by rail operators to customers, allow investment, on average, of more than $260,000 per mile of track. Passenger rail, however, is a different story. Amtrak and its 21,400-mile network (about 70 percent of which is owned by other railroads and is leased to Amtrak for service) requires government investment and has been hampered by a lack of federal support. Amtrak lists a current repair backlog at $45.2 billion. In 2019, along the nation's Northeast Corridor, the nation’s busiest, infrastructure-related issues caused 328,000 train-delay minutes, or the equivalent of roughly 700 Northeast Regional train trips from Boston, Massachusetts, to Washington, D.C.
New rail technology has focused on improving efficiency and safety, such as new fastening systems to improve track stability and special defect detection vehicles that discover flaws in rails. ASCE grade: B
Roads
It’s rare these days to drive from one state to another—or even along your daily commute— and not encounter road construction. The United States’ 4 million miles of public roadways are expected to withstand an ever-increasing volume of traffic each year, with vehicle miles traveled reaching more than 3.2 trillion in 2029, an 18 percent increase from 2000. Unfortunately, the growing wear and tear to our nation’s roads has left 43 percent of our public roadways in poor or mediocre condition, a number that has remained unchanged over the past several years. And while interstate highways tend to be in comparatively decent shape, many roads in rural and urban areas lag far behind.

Suburban road in Grand Island, New York. Credit: Niall_Majury, iStock
Overall, deteriorating roads force the nation’s motorists to spend nearly $130 billion each year on extra vehicle repairs and operating costs. In addition, the number of vehicle miles traveled on roads in “poor” condition has ticked up from 15 percent to more than 17 percent over the last decade. ASCE grade: D
Water & Wastewater
In the United States, there is a water line break every two minutes, and an estimated 6 billion gallons of treated water lost each day!
Of the more than 16,000 wastewater treatment plants countrywide, on average, 81 percent of them are functioning at capacity, while 15 percent have reached or exceeded it. As urban environments continue to expand, the demands on wastewater plants will also increase. Large-scale improvements have been made on sewer systems—estimates indicate that utilities spent over $3 billion in 2019, or more than $18 per wastewater customer to replace the almost 4,700 miles of pipeline nationwide. Much of those funds have been spent reactively on sewer line bursts and overflows versus proactively before emergencies occur.

Water treatment facility in Texas area just south of Houston. Credit: Art Wager, iStock
The sector has made strides to address current and future needs through planning and innovations that produce profitable byproducts. Some plants produce biogas that goes back into powering the facility itself. Others add chemicals to wastewater that allows nutrients, such as phosphorus and nitrates, to be extracted and then sold for agricultural applications.
When it comes to drinking water, the tragedy of Flint, MI, clearly demonstrates the importance of monitoring water sources and pipes. Utilities have responded by replacing—or planning to replace—more than 12,000 miles of water pipes across the country. Investments in drinking water maintenance increased by more than 20 percent from 2016 to 2019. Finally, water utilities have upped their game when it comes to deploying new water monitoring technologies: sensors and smart water quality monitors are increasingly commonplace. Still, the nation’s water supply systems could use an update. ASCE wastewater grade: D+. Drinking water grade: D
Broadband
When the coronavirus pandemic forced millions of Americans to stay home in 2020 and 2021, an estimated 1 in 5 school-aged children lacked the high-speed internet connection needed to access lessons and other materials.
Disadvantaged and rural communities fared worse. A study by the Center for Public Integrity reports that families with household incomes over $80,700 are five times more likely to have access to broadband than a household with income below $34,800 (the top fifth and lowest fifth income thresholds, respectively).
Americans’ reliance on fast internet is only forecasted to grow in the coming years. According to the Cellular Telecommunications Industry Association (CTIA), data use in 2018 was 73 times higher than in 2010. To meet the demand for data, the telecommunications industry is expanding and deploying more cell sites, launching 5G, and looking at the next generation of wireless.
Federal, state, and local governments and the private sector are working to close the digital divide. CTIA reports the telecom industry has spent over $253 billion in capital investments since the launch of 4G in 2010. In 2019, telecom invested $27.4 billion in expanding capacity, increasing coverage, developing infrastructure, and upgrading technology to support 5G. Through the Federal Communications Commission (FCC), the federal government disbursed more than $15 billion by funding various programs across the U.S. between 2000 and 2018. In 2020, the agency launched the Rural Digital Opportunity Fund, a 10-year, $20 billion program that will finance the deployment of faster broadband networks to underserved rural areas. ASCE grade: N/A
Ports
Our nation’s 300 coastal and inland ports are busy. Very busy. The pandemic saw records for household cargo smashed across the country’s terminals, as Americans stocked up on household goods. In October of 2020, the Port of New York/New Jersey moved 755,437 containers carrying household products, an all-time record. While money and goods have been flowing into ports, funds are also flowing out: Ports and port tenants plan to spend $163 billion between 2021 and 2025, up by over $8 billion in the last four years. The investments will go to improving efficiency and capacity, as tonnage at the top 25 ports has increased by 4.4 percent since 2015. Despite the increase in investment, there is a funding gap of over $12 billion for waterside infrastructure, such as dredging over the next 10 years, with additional billions needed for landside infrastructure. But compared to other infrastructure systems, America’s ports are in relatively good shape. ASCE grade: B-

A cable-powered crane uses a clamshell bucket to remove sand in a dredging operation in Port Orford, Oregon. Credit: tfoxfoto, iStock
Mega-Infrastructure Projects in Progress
Despite the economic effects of the pandemic, construction on dozens of massive U.S. infrastructure projects continued throughout 2020. These projects ranged from Washington, D.C.’s $5.6 billion Purple Line metro addition to the $5.7 billion Gordie Howe International Bridge, linking Detroit with Windsor, Ontario, across the Detroit River, to the $2.3 billion I-4 Ultimate Project, a massive highway improvement program in central Florida. But those are small potatoes compared to these three ongoing megaprojects:
- California High-Speed Rail. This publicly funded rail system is projected to connect the Anaheim Regional Transportation Intermodal Center in Anaheim and Union Station in Downtown Los Angeles with the Salesforce Transit Center in San Francisco, a total of 380 miles. Projected cost: $98 billion
- Sound Transit 3, Seattle. The plan, also known as ST3, will expand the existing Link light rail system to the suburbs of Tacoma, Federal Way, Everett, and Issaquah, as well as the Seattle neighborhoods of Ballard and West Seattle. Projected cost: $54 billion
- Second Avenue Subway. Phase 1 of New York City’s Second Avenue Subway, the city’s biggest expansion of the subway system in 50 years, opened for service in 2017. Phase 2 is now underway and when complete, the line will run 8.5 miles along Manhattan’s East Side, with 16 new stations. Projected cost: $11 billion
Dixon’s Outlook
Gaylon Black, sales territory manager at Dixon, says, “We’ve already seen an uptick in productivity from customers and I suspect things will only get better. A lot of worksites were shut down for several months and they have to do repairs. They've been running on Band-Aids and duct tape and now they're getting back to work."
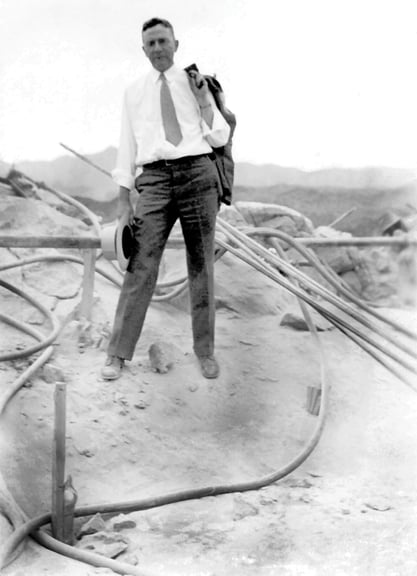
Throughout its 105-year history, Dixon has played a major role in shaping American infrastructure projects. The company's products have been used in some of the country's most iconic public works, including the construction of the Golden Gate Bridge and the Hoover Dam. Black notes that Dixon will continue to play an important role in supporting America's infrastructure projects, whether it's in road and bridge construction, power and energy, railroads, or wherever high-quality parts and equipment are required. "One of the great things about Dixon is that we cover almost all markets—oil and gas, food and beverage, pulp and paper," he says. "Through our divisions, we play a part in all of them. The diversity of our product lines is one of our greatest strengths. I have always referred to Dixon as the Wal-Mart of the industry. We have anything the industry needs, and it can be found in one place."
 Howard W. Goodall, the founder of Dixon, inspecting couplings at the Hoover Dam in 1932.
No matter how the infrastructure bill plays out, Black says the company is primed for a positive 2021. "It’s been a tough go for the economy the last 12 to 18 months, but on the back side of that, people are starting to repair things and build things and I think Dixon will play a key role, no matter the industry. I have a good outlook when it comes to future infrastructure projects, and I am very excited about it."
To learn more about all of the markets that Dixon services please visit our markets page. If you would like to speak with a specialist about your particular application or questions email sales@dixonvalve.com or call 877.963.4966.
If you enjoyed the post, please share it with your colleagues, and don’t forget to subscribe!
Sources:
History, stats, and grades:
https://origins.osu.edu/article/how-public-and-private-enterprise-have-built-american-infrastructure
https://www.fhwa.dot.gov/infrastructure/back0103.cfm
https://www.smithsonianmag.com/history/when-america-invested-infrastructure-these-beautiful-landmarks-were-result-180953570/
https://infrastructurereportcard.org
https://www.bigrentz.com/blog/state-of-us-infrastructure
https://www.govtrack.us/congress/bills/116/hr7869
https://www.cfr.org/backgrounder/state-us-infrastructure
https://www.whitehouse.gov/briefing-room/statements-releases/2021/03/31/fact-sheet-the-american-jobs-plan/
https://www.nytimes.com/2021/03/31/nyregion/ny-nj-ports-pandemic.html
https://www.cbpp.org/research/state-budget-and-tax/its-time-for-states-to-invest-in-infrastructure
Megaprojects:
https://i4ultimate.com/project-info/
https://www.washingtonpost.com/transportation/2019/03/22/maryland-purple-line-contractor-still-far-apart-lines-cost-opening-date/
https://hsr.ca.gov/
https://www.thetranstecgroup.com/infrastructure-week-2019-largest-projects/
http://soundtransit3.org/
https://www.nytimes.com/2017/12/28/nyregion/new-york-subway-construction-costs.html
https://www.masstransitmag.com/rail/infrastructure/blog/21147543/oped-why-the-ny-mta-will-have-to-postpone-69billion-second-avenue-subway-phase-2-to-the-next-fiveyear-capital-program


